Java 11 – Java Flight Recorder
Java Flight Recorder (JFR) is a Java profiling tool that used to monitor and diagnose a running Java application, it collects data about the running environment, JVM and Java application and dumps the recorded data into a .jfr file, and we can use Java Mission Control (JMC) to analyze and visualize the .jfr file.
Tested with
- OpenJDK 11
- JMC 7 – https://jdk.java.net/jmc/
- Docker 19.03.8
Short history
Before Java 11, both Java Flight Recorder (JFR) and Java Mission Control (JMC) are commercial products and only available in Oracle JDK, and we can enable the JFR features via the following commands:
$ java -XX:+UnlockCommercialFeatures -XX:+FlightRecorder MyHelloWorldApp
Now, the JFR is open source in OpenJDK 11, and available in the OpenJDK11/bin folder; while the JMC is not part of the JDK anymore, we can download here.
In this article, we will show you how to use the Java Flight Recorder (JFR) to monitor and collect the data from a memory leaks Java application, dumps data into a .jfr file, and use Java Mission Control (JMC) to analyzed and visualized the data to find the cause of the memory leaks.
1. OutOfMemoryError (OOME)
We create a Java producer and consumer program that generates memory leaks in a speedy time and throws a popular java.lang.OutOfMemoryError runtime exception.
The producer generates object too fast and there is no limit in LinkedBlockingQueue, throwing a java.lang.OutOfMemoryError is just a matter of time.
import java.util.concurrent.*;

public class MemoryLeak {

    // no limit!
    private static BlockingQueue<byte[]> queue = new LinkedBlockingQueue<>();

    public static void main(String[] args) {

        Runnable producer = () -> {
            while (true) {
                // generates 1mb of object every 10ms
                queue.offer(new byte[1 * 1024 * 1024]);
                try {
                    TimeUnit.MILLISECONDS.sleep(10);
                } catch (InterruptedException e) {
                    e.printStackTrace();
                }
            }
        };

        Runnable consumer = () -> {
            while (true) {
                try {
                    // process every 100ms
                    queue.take();
                    TimeUnit.MILLISECONDS.sleep(100);
                } catch (InterruptedException e) {
                    e.printStackTrace();
                }
            }
        };

        // give a name, good for profiling
        new Thread(producer, "Producer Thread").start();
        new Thread(consumer, "Consumer Thread").start();

    }

}
Output – After 10 or 20 seconds…
Exception in thread "Producer Thread" java.lang.OutOfMemoryError: Java heap space
	at com.mkyong.java11.jep328.OOME.lambda$main$0(OOME.java:14)
	at com.mkyong.java11.jep328.OOME$$Lambda$14/0x0000000800066840.run(Unknown Source)
	at java.base/java.lang.Thread.run(Thread.java:834)
2. Java Flight Recorder (JFR)
2.1 To enable JFR recording, start the above Java application with the option -XX:StartFlightRecording. The below example starts a 30 seconds JFR fixed-time recording for MemoryLeak.java and dumps the recorded data into a file called leak.jfr.
$ javac MemoryLeak.java

$ java -XX:StartFlightRecording=duration=30s,settings=profile,filename=leak.jfr MemoryLeak

Started recording 1. The result will be written to:

{pwd}/leak.jfr

Exception in thread "Producer Thread" java.lang.OutOfMemoryError: Java heap space
        at MemoryLeak.lambda$main$0(MemoryLeak.java:12)
        at MemoryLeak$$Lambda$71/0x00000008000ff840.run(Unknown Source)
        at java.base/java.lang.Thread.run(Thread.java:834)
After 10 or 20 seconds, it will throws the expected java.lang.OutOfMemoryError, CTRL+C to stop and kill the threads. Later we can use Java Mission Control (JMC) to analyze the leak.jfr to find the memory leaks.
2.2 JFR settings. If omitted, default is default.jfc.
default.jfc(default) – Low overhead, good for continue recordings.profile.jfc– More overhead, more recorded data and events than thedefault.jfc, good for short time recording.
In this example, we use the JFR profile settings, because we know the MemoryLeak.java will throw the OutOfMemoryError very soon 🙂
P.S The JFR setting files are available in OpenJDK11_Path/lib/jfr.
Further Reading – Refer to this JFR options reference.
3. Java Mission Control (JMC)
3.1 Download the JMC here. Go JMC_FOLDER/bin and run the jmc executable file.
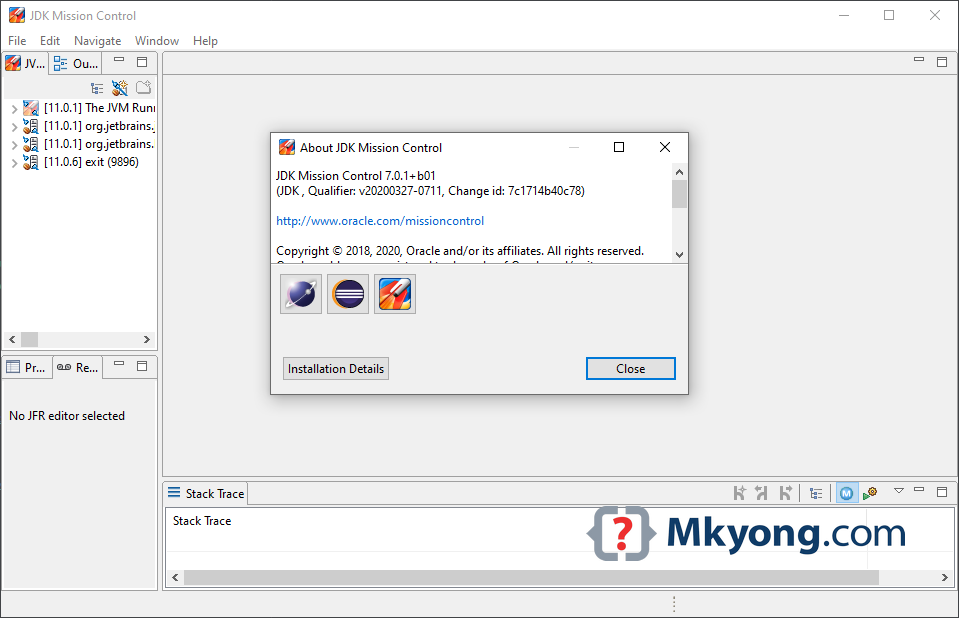
3.2 File -> Open File…Choose leak.jfr
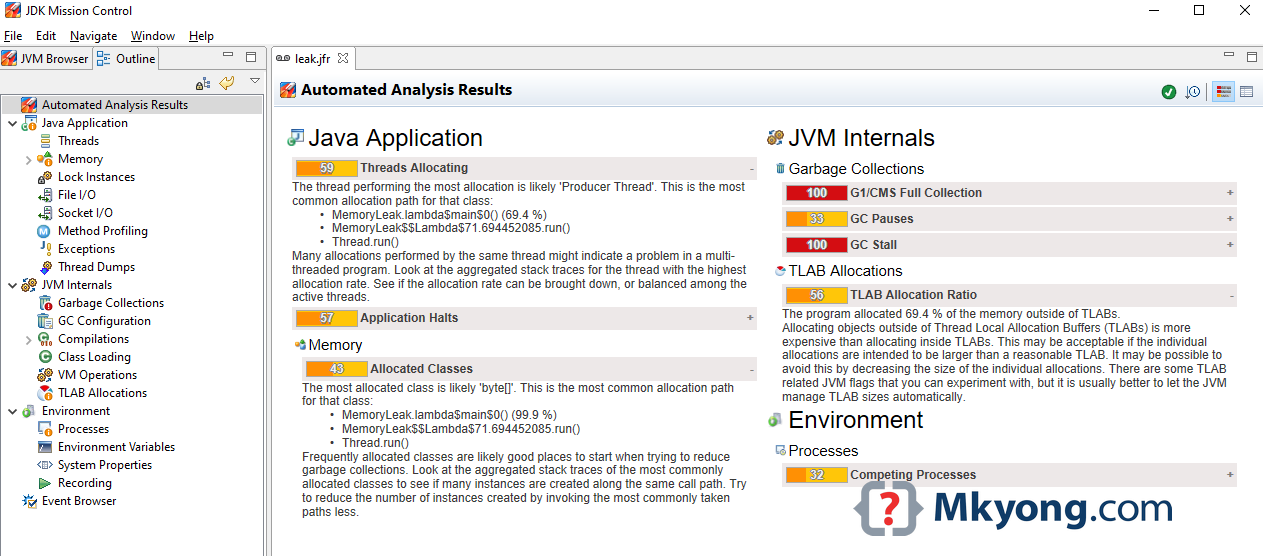
The Automated Analysis Results is promising; there are many warnings and even scored 100 dangerous signals. Review the Threads Allocation section, it told you directly that the Producer Thread has a problem.
The thread performing the most allocation is likely *Producer Thread*. This is the most common allocation path for that class: •MemoryLeak.lambda$main$0() (69.4 %)

Many allocations performed by the same thread might indicate a problem in a multi-threaded program. Look at the aggregated stack traces for the thread with the highest allocation rate.
3.3 Select the memory option; the memory usage increased steadily, a clear signal that is a memory leaks issue.
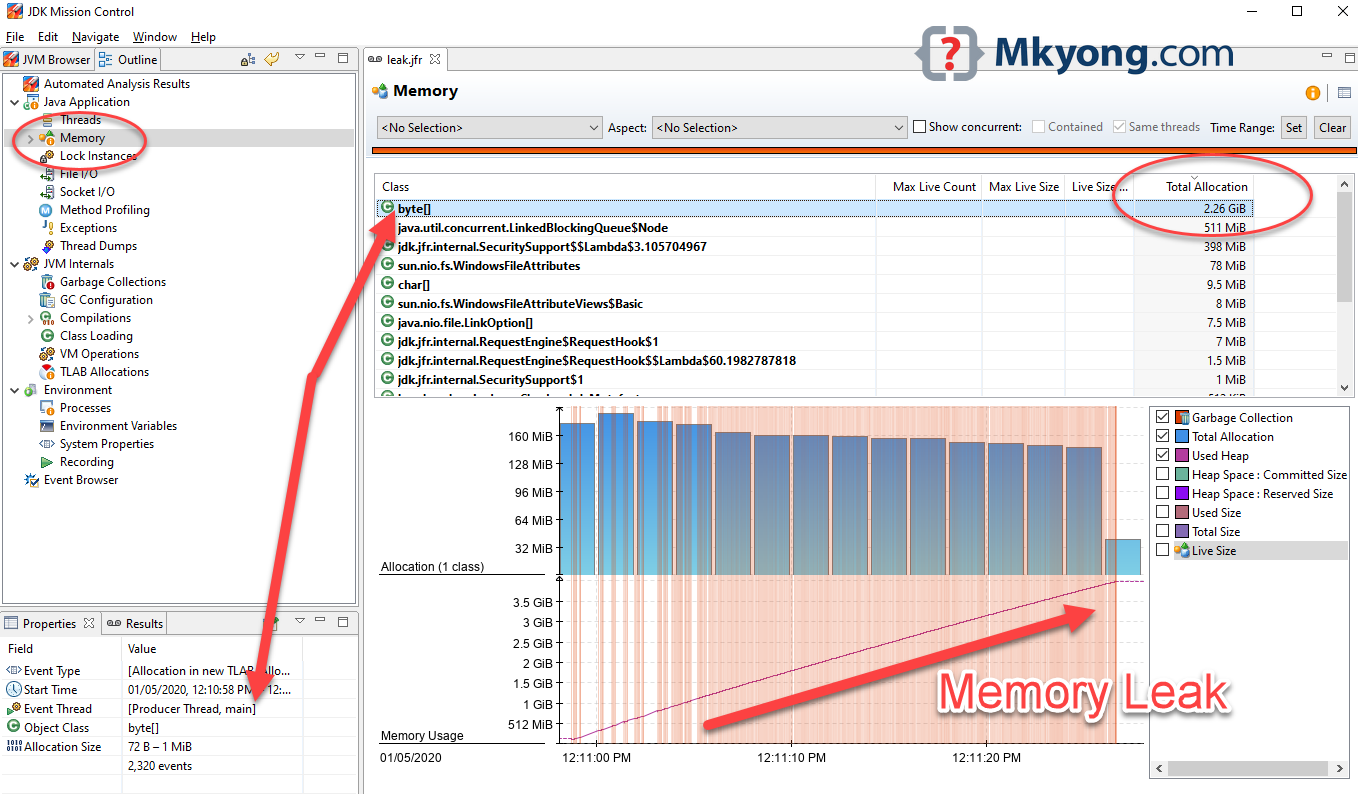
Furthermore, total allocation for byte[] is 2.6G, and the properties, showing event thread is Producer Thread.
3.4 Select Live Objects
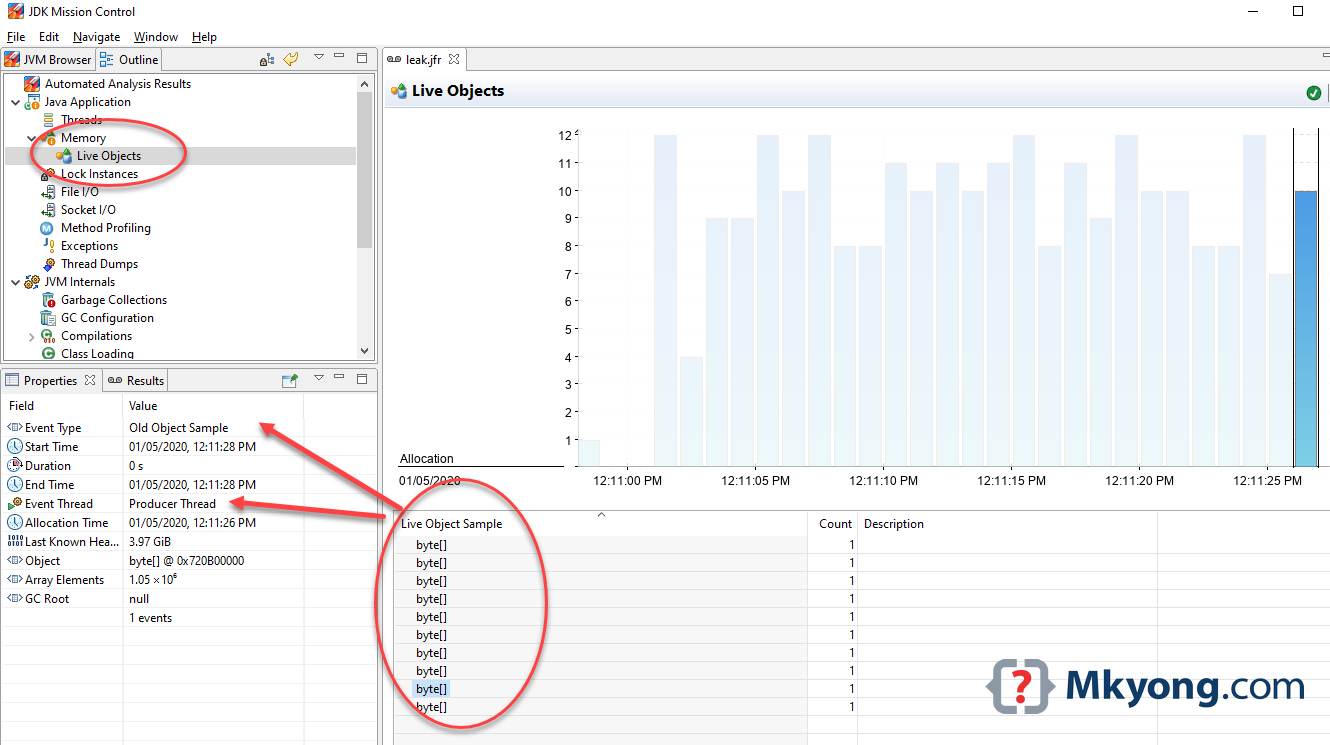
All the live object samples belong to Producer Thread. Review the Old Object Sample, it told you much useful info like Start time, End time, Duration, Last Known Heap, helpful info for diagnostic.
All indicators are telling you that the Producer Thread caused the memory leaks.
4. JCMD – Running Java process
For the running Java process or application, we can use jcmd to start a JFR recording and dumps the data to a .jfr file. This jcmd is available in the JDK 11/bin, not JRE.
4.1 Type jcmd, it lists all the available Java processes and its PID.
$ jcmd

1 app.jar
47 jdk.jcmd/sun.tools.jcmd.JCmd
4.2 We need to enable JFR for this app.jar and the process is 1.
$ jcmd 1 JFR.start duration=30s settings=profile filename=path/filename.jfr

1:
Started recording 2. The result will be written to:

{pwd}/filename.jfr
Done, we can use the JMC to analyze the .jfr file.
4.3 jcmd start, check, and dump, all required pid.
# start a 1 hour continue monitoring
$ jcmd pid JFR.start name=monitor1hour maxage=1h maxsize=100M filename=path/filename.jfr

# check what is recording now
$ jcmd pid JFR.check

pid:
Recording 3: name=monitor1hour maxsize=100.0MB maxage=1h (running)

# Dump the data for analysis even the recording is running
$ jcmd 1 JFR.dump name=monitor1hour

pid:
Dumped recording "monitor1hour", 456.1 kB written to:
Further Reading – Refer to this jcmd Diagnostic Command Reference
5. Docker and JFR
Can I enable JFR in the Java process that is inside a Docker container? The answer is yes.
P.S Tested with OpenJDK11 and Docker 19.03.8.
5.1 A simple DockerFile to start an openjdk11:alpine container and run the app.jar file.
FROM adoptopenjdk/openjdk11:alpine

VOLUME /tmp

ARG JAR_FILE=target/hello.jar

WORKDIR /opt/app

COPY ${JAR_FILE} app.jar

ENTRYPOINT ["java","-jar","app.jar"]
5.2 Build and start Docker.
# maven clean build the projects
$ mvn clean package

# create a docker image
$ docker build -t myapp:1.0 .

# Run
$ docker run -d -p 80:8080 -t myapp:1.0
5.3 We can access the docker container and enable the JFR for the running Java process.
$ docker ps

CONTAINER ID        IMAGE               COMMAND               CREATED             STATUS              PORTS                   NAMES
5c27d3cfdfa3        myapp:1.0    "java -jar app.jar"   25 minutes ago      Up 25 minutes       0.0.0.0:80->8080/tcp,   hungry_benz

# Access the container
$ docker exec -it 5c27d3cfdfa3 sh

/opt/app #
5.4 The process is the same, jcmd to find the pid and enable the JFR.
$ jcmd pid JFR.start duration=30s settings=profile filename=path/filename.jfr
5.5 Copy the .jfr from the docker container to your computer or host.
# exit the docker container shell
/opt/app # exit

$ docker ps
CONTAINER ID        IMAGE               COMMAND               CREATED             STATUS              PORTS                   NAMES
5c27d3cfdfa3        myapp:1.0    "java -jar app.jar"   25 minutes ago      Up 25 minutes       0.0.0.0:80->8080/tcp,   hungry_benz

# docker cp <containerId>:/file/path/within/container /host/path/target

$ docker cp 5c27d3cfdfa3:/opt/app/file.jfr /home/mkoyng/test
Done, we get the .jfr file.
Further Reading – Read JMC_Tutorial.pdf from this JDK Mission Control Tutorial; it contains many case study.
6. Fix this memory leaks?
Limit LinkedBlockingQueue is the quick fix, but this creates another problem for the producer.
private static BlockingQueue<byte[]> queue = new LinkedBlockingQueue<>(100);
If the producer can produce a large number of objects or data in a short time, better store it into a persistent database or message queue like RabbitMQ. Your comment?
Download Source Code
$ cd java-11
/src/main/java/com/mkyong/java11/jep328/MemoryLeak.java
/src/main/resources/jep328/leak.jfr
